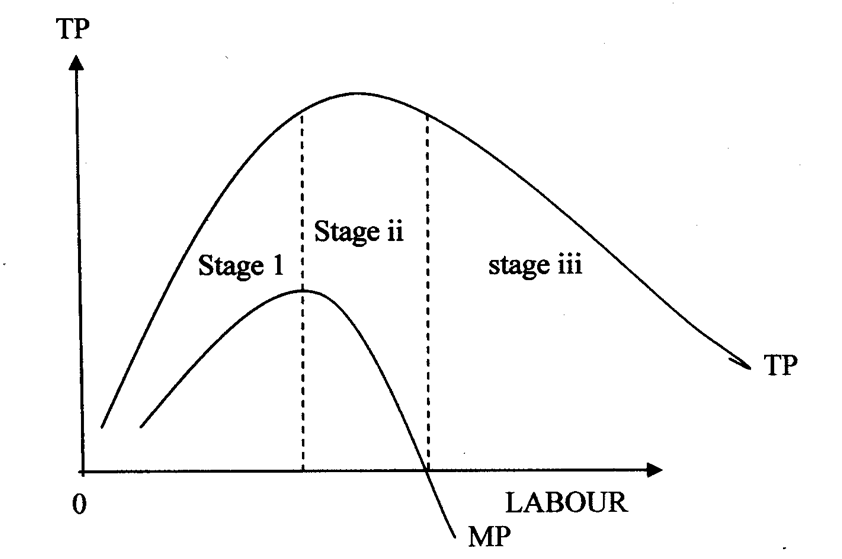
Regions of the production function
These are also called stages of production. The production function is graphically represented by the total product ( TP) curve.
Regions of the production function.

As the variable factor is increased and as total product ( TP) increases, the following stages of the production function can be observed:-
Stage I: This starts at a point where out put is equal to zero up to a point where MP= Ap. In this region, the fixed factor is under utilised, implying that the variable factor to fixed factor ratio is low. There fore, it pays for the producer to employ more of the variable factor.
Stage II: This is referred to as the economic or optimal region of production. It starts from a point where MP=AP up to a point where TP is maximum ( where MP= O). A point maximising producer should produce within this region.
Stage III: This starts from the point where total output is maximum ( MP =O). In this region, output falls continuously as the variable factor increases. The marginal product in this region is negative. It is advisable that the producer should not produce in this region and neither should he employ any more variable factor even if it is free.